Telegraf & PVEStatd
Proxmox already integrates an stats collector that displays statistics in the Proxmox GUI, so I only have to send those stats to a database to later display them in Grafana.
Those metrics are not totally complete since they lack in temperature, fan RPMs, disks and a few more statistics that I like. Those are also collected by Telegraf
Deployment
PVEStatd
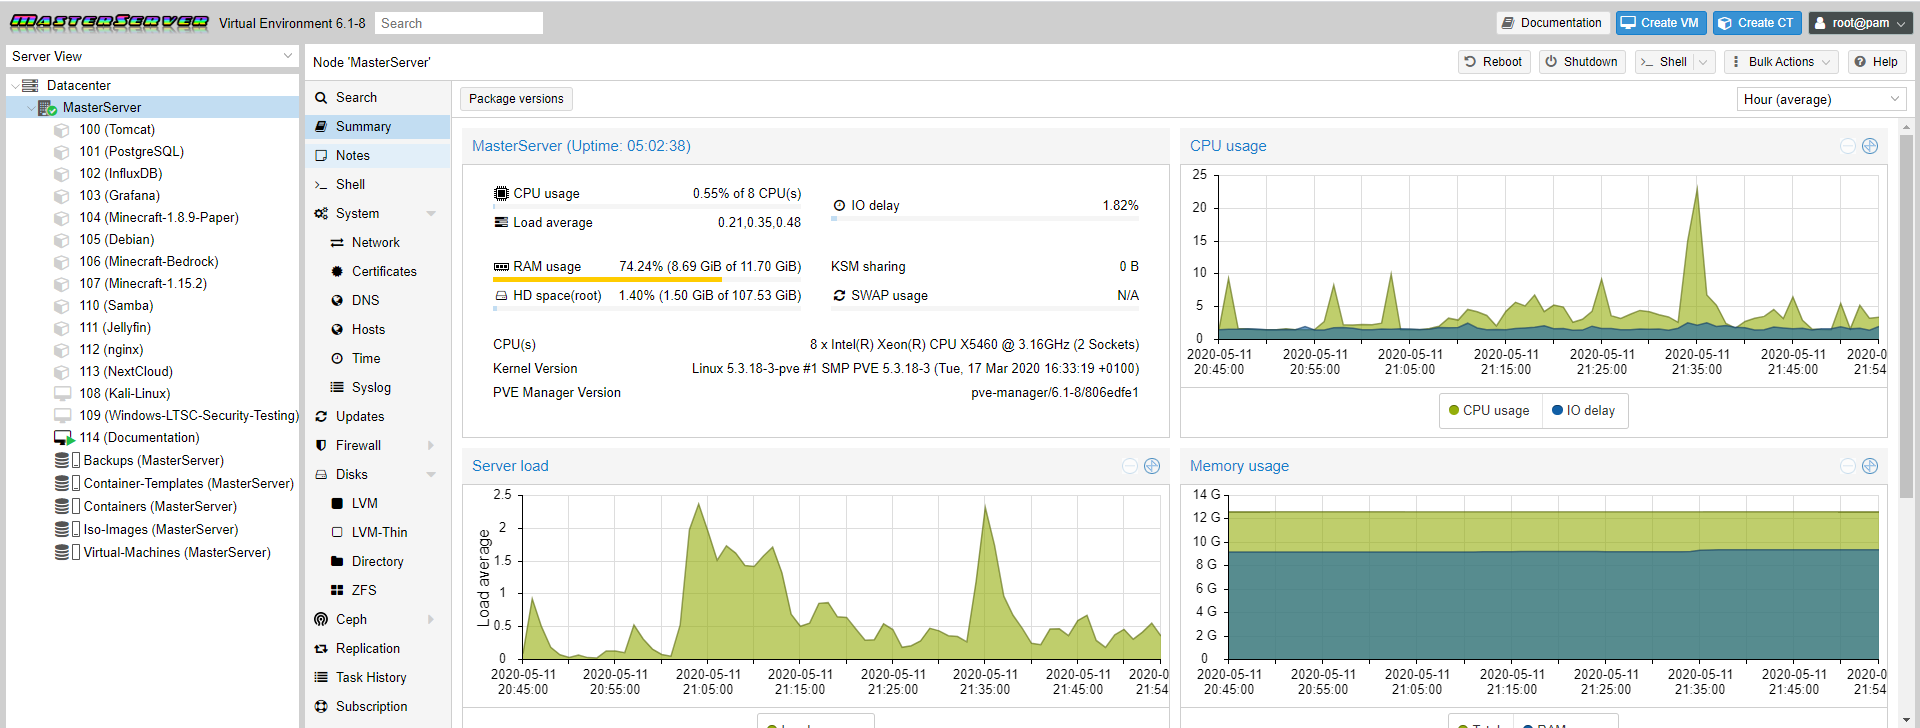
PVEStatd is the Proxmox service that manages all the statistics not only of each node or server, but also the whole datacenter.
Since I don’t want anyone to be aware of the complex structure or give access to the Proxmox manager, I’m sending those stats to the InfluxDB server so I can manage them by myself.
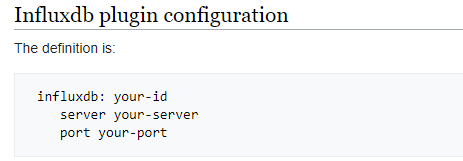
The Proxmox manual (only written in english and not translated) says to edit the /etc/pve/status.cfg file and add the InfluxDB definition as it follows.
After restarting the service I checked the InfluxDB database and saw if there was any new data arriving. Nothing happened, so I checked the pvestatd status.
The service was running and the status was active. Anyway, reading it’s output I saw all the 3 lines in the config file were being ignored for some reason.
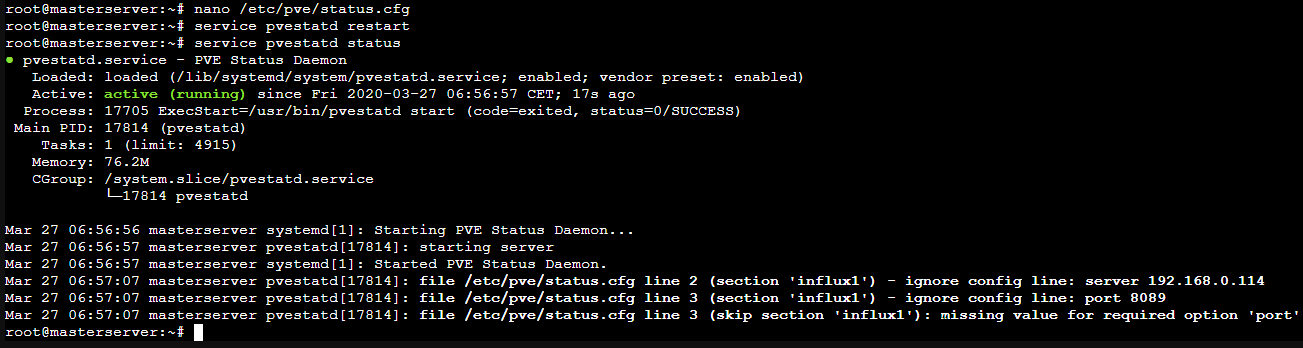
I concluded that the problem was residing in the config file, so I tried with different spacing in the arguments.
It ended up being that the problem. In the manual they used spaces instead of tabs and thats wrong!.
Using tabs worked perfectly and I started receiving data in InfluxDB!
Im not the only one who ran into that problem. There are several unsolved threads in the Proxmox forum related to that bug.
The final status.cfg file looks like this;
influxdb: MasterServer
        server 192.168.0.114
        port 8089
Telegraf
Proxmox pvestatd offers tons of data but I digged if I could get more.
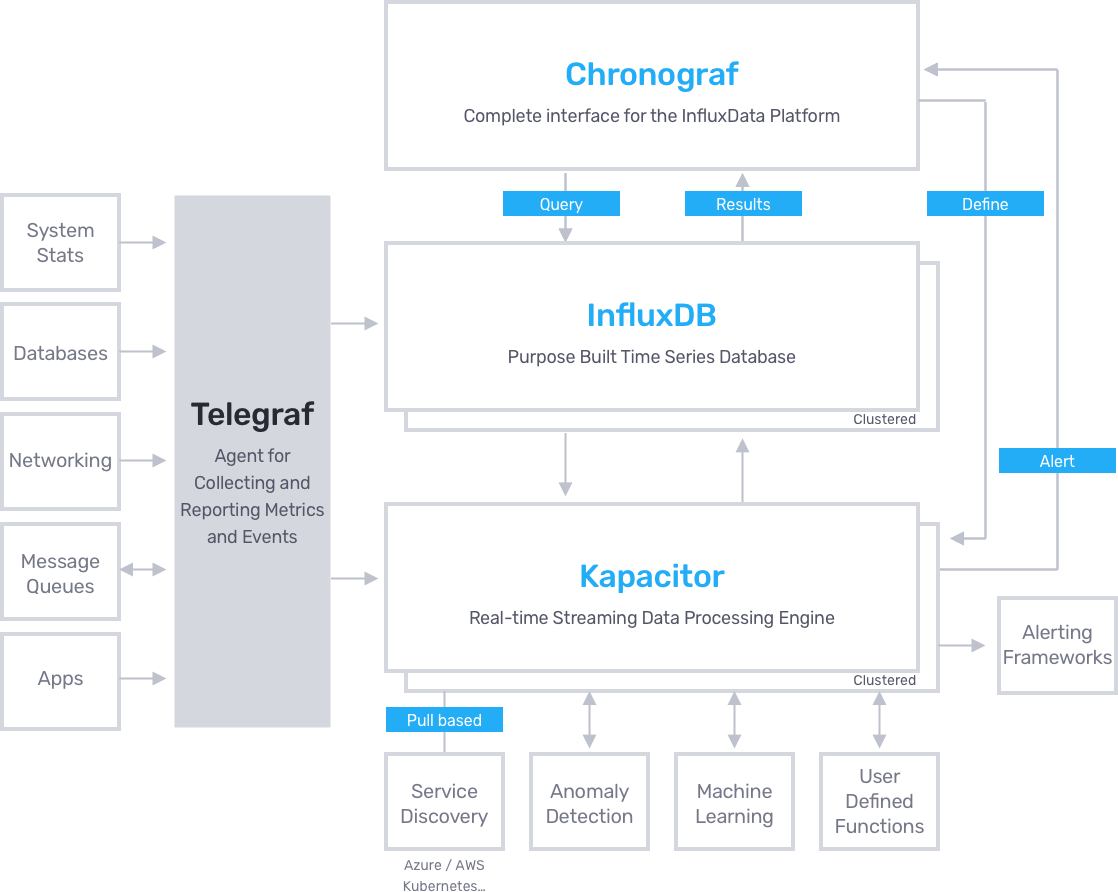
Telegraf is a stats data collector developed by the same team as InfluxDB. Proxmox lacks when it comes to giving temperature stats and I consider them of vital importance.
I installed Telegraf in the Proxmox host OS since it’s based on Debian.
wget https://dl.influxdata.com/telegraf/releases telegraf_1.14.0-1_amd64.deb
dpkg -i telegraf_1.14.0-1_amd64.deb
The way Telegraf works is through plugins. Those plugins collect outputs from different system files or programs.
It’s important to know that it’s not able to interact with hardware at low level, simply collects data from different sources specified by the plugins.
The plugins that I used can be found here and are the following;
- S.M.A.R.T [1] ; Collects metrics using the command
smartctl. - ZFS; Collects metrics from the ZFS filesystems found in the /proc/spl/kstat/zfs folder and using the commands
sysctlandzpool. - Sensors; Collects metrics using the command
sensors.
There were 2 plugins that I first tried and removed them because they didnt fit my needs and likings; The Temp plugin which only gave temperatures from a single CPU and hddtemp that was redundant since S.M.A.R.T already gives the drives temperature.
Smartctl and ZFS are already installed by default in Proxmox.
lm-sensors
To install lm-sensors I simply did
apt-get install lm-sensors.To configure it just execute
sensors-detect. Its a wizard [2] that will ask what kind of devices to detect. I answered yes to all of them so everything will be autodetected.After finishing the detection it will add the corresponding kernel modules to the /etc/modules file.
Here can be seen the ones it detected.
# /etc/modules: kernel modules to load at boot time.
#
# This file contains the names of kernel modules that should be loaded
# at boot time, one per line. Lines beginning with "#" are ignored.
vfio
vfio_iommu_type1
vfio_pci
vfio_virqfd

# Generated by sensors-detect on Mon Apr 13 00:38:00 2020
# Chip drivers
coretemp
15k_amb
smsc47ml
The problem was the sensor smsc47m1 was not showing up so I manually tried loading the kernel module manually with
modprobe smsc47m1 and got the error.root@masterserver:~# modprobe smsc47m1
modprobe: ERROR: could not insert 'smsc47m1': Device or resource busy
With modinfo I could get more info about the kernel module.
root@MasterServer:~# modinfo smsc47m1
filename:       /lib/modules/5.3.18-3-pve/kernel/drivers/hwmon/smsc47m1.ko
license:        GPL
description:    SMSC LPC47M1xx fan sensors driver
author:         Mark D. Studebaker <mdsxyz123@yahoo.com>
srcversion:     72B57F526144C4C9D4EA53F
depends:
retpoline:      Y
intree:         Y
name:           smsc47m1
vermagic:       5.3.18-3-pve SMP mod_unload modversions
parm:           force_id:Override the detected device ID (ushort)
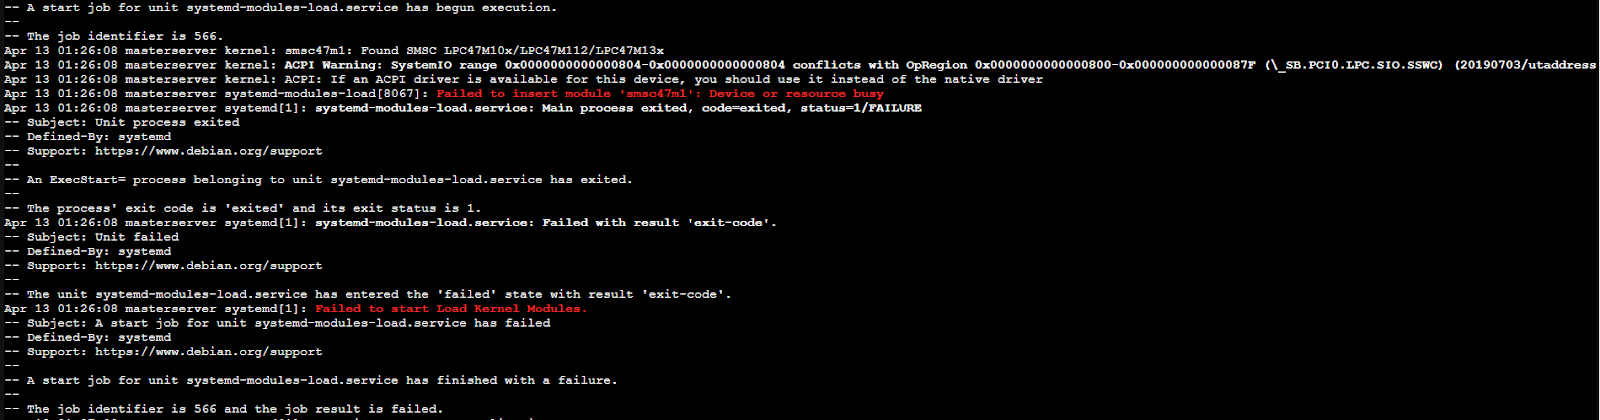
Checking the status of kmod and executing
journalct -xe I got more info.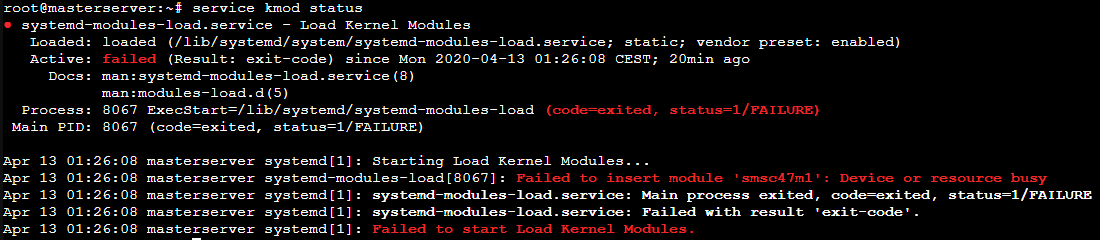
Even tho I had the HWInfo report I decided to double check the Super I/O controller was the correct one for the loaded kernel module. I installed superiotool with
apt-get.root@MasterServer:~# superiotool
superiotool r6637
Found SMSC LPC47M10x/112/13x (id=0x59, rev=0x00) at 0x2e
In fact the module detected the right Super I/O so it was something different.
After digging a while I discovered the problem was the ACPI [3], an open standard that replaces PnP, APM and MPS. It also includes lots of features such as Global and Sleep states and CPU, Devices and Performance states (Gx,Cx,Dx,Px, where x is a number).
To let the driver have access to the ACPI I had to edit the GRUB configuration file.
I tried looking for /boot/grub/menu.lst but didnt find the file which is supposed to have all the GRUB configs.
After looking it up I found out that for GRUB2 the config file is grub.conf instead of menu.lst.
Anyway that file didnt have the configuration I looked for which instead was the /etc/default/grub file I was looking for because it didnt have the GRUB_CMDLINE_LINUX=’’ string.
The file content ended like this.
# If you change this file, run 'update-grub' afterwards to update
# /boot/grub/grub.cfg.
# For full documentation of the options in this file, see:
#   info -f grub -n 'Simple configuration'

GRUB_DEFAULT=0
GRUB_TIMEOUT=5
GRUB_DISTRIBUTOR="Proxmox Virtual Environment"
GRUB_CMDLINE_LINUX_DEFAULT="quiet"
GRUB_CMDLINE_LINUX="root=ZFS=rpool/ROOT/pve-1 boot=zfs acpi_enforce_resources=lax"

# Disable os-prober, it might add menu entries for each guest
GRUB_DISABLE_OS_PROBER=true

# Uncomment to enable BadRAM filtering, modify to suit your needs
# This works with Linux (no patch required) and with any kernel that obtains
# the memory map information from GRUB (GNU Mach, kernel of FreeBSD ...)
#GRUB_BADRAM="0x01234567,0xfefefefe,0x89abcdef,0xefefefef"

# Uncomment to disable graphical terminal (grub-pc only)
#GRUB_TERMINAL=console

# The resolution used on graphical terminal
# note that you can use only modes which your graphic card supports via VBE
# you can see them in real GRUB with the command `vbeinfo'
#GRUB_GFXMODE=640x480

# Uncomment if you don't want GRUB to pass "root=UUID=xxx" parameter to Linux
#GRUB_DISABLE_LINUX_UUID=true

# Disable generation of recovery mode menu entries
GRUB_DISABLE_RECOVERY="true"

# Uncomment to get a beep at grub start
#GRUB_INIT_TUNE="480 440 1"
After editing it I did
update-grub to apply the changes and restarted the MasterServer.It worked as it should and executing
sensors displayed all the info.root@MasterServer:~# sensors
coretemp-isa-0001
Adapter: ISA adapter
Core 0: +61.0°C (high = +84.0°C, crit = +100.0°C)
Core 1: +57.0°C (high = +84.0°C, crit = +100.0°C)
Core 2: +51.0°C (high = +84.0°C, crit = +100.0°C)
Core 3: +45.0°C (high = +84.0°C, crit = +100.0°C)
i5k_amb-isa-0000
Adapter: ISA adapter
Ch. 0 DIMM 0: +88.5°C (low = +118.0°C, high = +124.0°C)
Ch. 0 DIMM 1: +101.0°C (low = +118.0°C, high = +124.0°C)
Ch. 0 DIMM 2: +111.5°C (low = +118.0°C, high = +124.0°C)
Ch. 1 DIMM 0: +113.5°C (low = +118.0°C, high = +124.0°C)
Ch. 1 DIMM 1: +107.0°C (low = +118.0°C, high = +124.0°C)
Ch. 1 DIMM 2: +88.0°C (low = +118.0°C, high = +124.0°C)
nouveau-pci-0700
Adapter: PCI adapter
GPU core: +0.88 V (min = +0.84 V, max = +1.16 V)
fan1: 1560 RPM
temp1: +33.0°C (high = +95.0°C, hyst = +3.0°C)
(crit = +105.0°C, hyst = +5.0°C)
(emerg = +135.0°C, hyst = +5.0°C)
coretemp-isa-0000
Adapter: ISA adapter
Core 0: +45.0°C (high = +84.0°C, crit = +100.0°C)
Core 1: +41.0°C (high = +84.0°C, crit = +100.0°C)
Core 2: +37.0°C (high = +84.0°C, crit = +100.0°C)
Core 3: +33.0°C (high = +84.0°C, crit = +100.0°C)
Setup
Telegraf includes a command to easily create a config file with the desired plugins. In /etc/telegraf I executed the following commands.
service telegraf stop
./telegraf -sample-config -input-filter temp:smart:sensors:zfs -output-filter influxdb >telegraf.conf
mv telegraf.conf /etc/telegraf/telegraf.conf
service telegraf start
This way the plugins default configuration is added to the config file. Anyway we can get each plugin configuration from github here and add it to the config file.
The original file is too long to be showed here so I just put the parts that I modified after generating the config file.
 ###############################################################################
 #                            OUTPUT PLUGINS                                   #
 ###############################################################################


 # Configuration for sending metrics to InfluxDB
 [[outputs.influxdb]]
   ## The full HTTP or UDP URL for your InfluxDB instance.
   ##
   ## Multiple URLs can be specified for a single cluster, only ONE of the
   ## urls will be written to each interval.
   # urls = ["unix:///var/run/influxdb.sock"]
   urls = ["udp://192.168.0.114:8089"]
   # urls = ["http://192.168.0.114:8086"]

   ## The target database for metrics; will be created as needed.
   ## For UDP url endpoint database needs to be configured on server side.
    database = "telegraf"

 ###############################################################################
 #                            INPUT PLUGINS                                    #
 ###############################################################################


 # Read metrics from storage devices supporting S.M.A.R.T.
 [[inputs.smart]]
   ## Optionally specify the path to the smartctl executable
   # path = "/usr/bin/smartctl"

   ## On most platforms smartctl requires root access.
   ## Setting 'use_sudo' to true will make use of sudo to run smartctl.
   ## Sudo must be configured to to allow the telegraf user to run smartctl
   ## without a password.
 use_sudo = true

   ## Skip checking disks in this power mode. Defaults to
   ## "standby" to not wake up disks that have stoped rotating.
   ## See --nocheck in the man pages for smartctl.
   ## smartctl version 5.41 and 5.42 have faulty detection of
   ## power mode and might require changing this value to
   ## "never" depending on your disks.
   # nocheck = "standby"

   ## Gather all returned S.M.A.R.T. attribute metrics and the detailed
   ## information from each drive into the 'smart_attribute' measurement.
 attributes = true

   ## Optionally specify devices to exclude from reporting.
   # excludes = [ "/dev/pass6" ]

   ## Optionally specify devices and device type, if unset
   ## a scan (smartctl --scan) for S.M.A.R.T. devices will
   ## done and all found will be included except for the
   ## excluded in excludes.
   # devices = [ "/dev/ada0 -d atacam" ]

   ## Timeout for the smartctl command to complete.
   # timeout = "30s"

 # Monitor sensors, requires lm-sensors package
 [[inputs.sensors]]
   ## Remove numbers from field names.
   ## If true, a field name like 'temp1_input' will be changed to 'temp_input'.
   # remove_numbers = true

   ## Timeout is the maximum amount of time that the sensors command can run.
   # timeout = "5s"


 [[inputs.zfs]]
   ## ZFS kstat path. Ignored on FreeBSD
   ## If not specified, then default is:
   # kstatPath = "/proc/spl/kstat/zfs"

   ## By default, telegraf gather all zfs stats
   ## Override the stats list using the kstatMetrics array:
   ## For FreeBSD, the default is:
   # kstatMetrics = ["arcstats", "zfetchstats", "vdev_cache_stats"]
## For Linux, the default is:
# kstatMetrics = ["abdstats", "arcstats", "dnodestats", "dbufcachestats",
#     "dmu_tx", "fm", "vdev_mirror_stats", "zfetchstats", "zil"]

## By default, don't gather zpool stats
poolMetrics = true
I used the UDP protocol to send data to the telegraf database in InfluxDB. For smartctl, enabled use sudo and attributes settings so it can output advanced metrics like the temperature. Finally for ZFS enabled poolMetrics so it can give the status of pools and other advanced metrics.
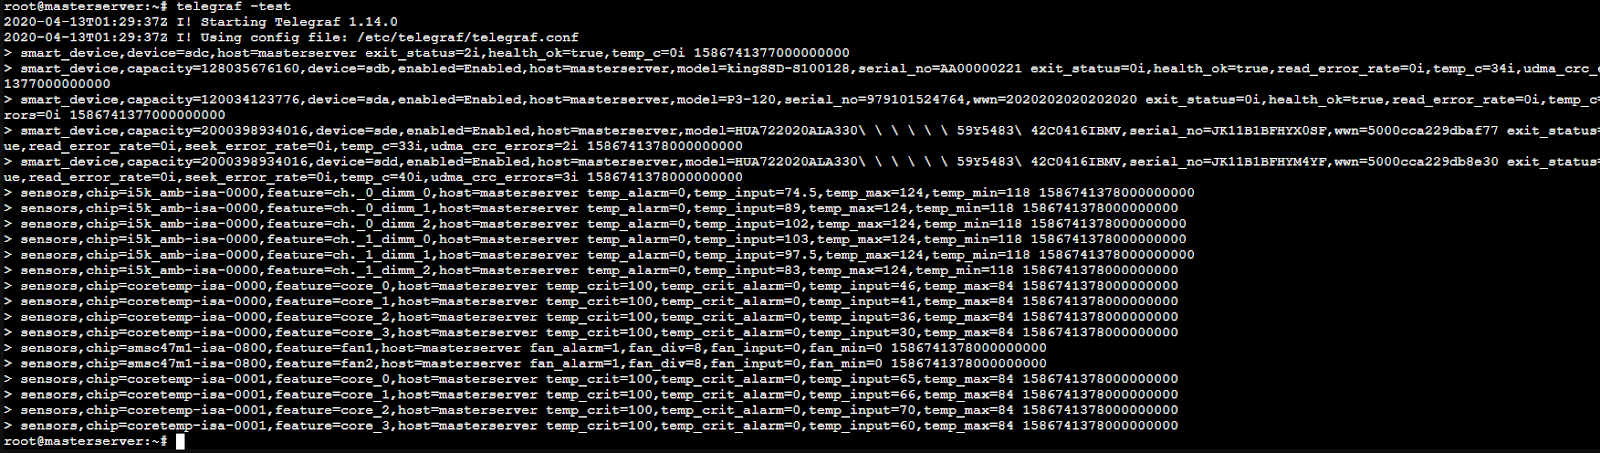
Finally I checked that telegraf was outputting the correct metrics and they were arriving to the database.
Footnotes
| [1] | Self-Monitoring Analysis & Reporting Technology |
| [2] | Setup asistance presented to the user in dialog boxes |
| [3] | Advanced Configuration & Power Interface |